- Home
- Deceptions
- Solar
- Thermal Audit
- Ventilation
- Sensors
- Governance
- Environment
- Reference
- Contact
- News
Solar Insolation
How much energy can you get from the Sun?
The maps below show the solar energy that is available in North America for December (worst case) and June (best case). You can click on the maps for a higher resolution image. If you know how much energy you need (such as needing 10kWh a day for heating, and the efficiency of your collector (perhaps 50% for a evacuated tube solar collector), you can calculate the area required for your collectors. This exercise is instructive because it illustrates just how large the collectors would have to be in order to heat an entire house. Unless we can change the laws of physics or recruit an extra sun to join our solar system, we have to live within the parameters of nature. Some examples -- heating a typical house in December in Eastern Canada would require a solar collector larger than the house, covering the roof and much of the back yard. Using solar to generate domestic hot water is somewhat more practical, especially if you can cut back demand with low flow shower heads, take short showers and do your laundry washing with cold water.
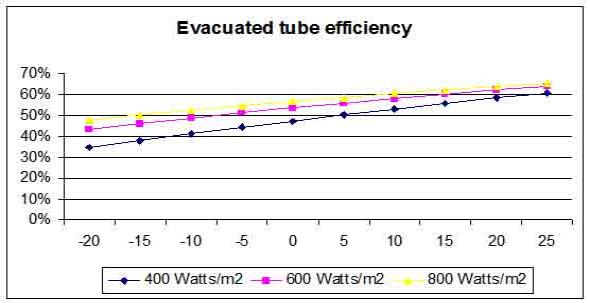
The graph below is generated using the parameters from Apricus brand tubes, assuming that water is being heated to 50°C in the manifold and illustrates some important concepts. As the outdoor temperatures drops (the horizontal axis is the temperature in degrees C), so does the efficiency of the collector. This is due to heat losses which are proportional to the temperature difference. The second is as the solar output falls (e.g. Winter), the tubes heat up less and transfer less heat, further reducing efficiency. Therefore, on a cold and freezing winter day, you could expect only about 40% of the available heat could be collected. Finally, any collector surface area calculated will have to be increased by a factor of about 1.8 because there is space between each tube and the performance equations are only for the parts of the collector that actually absorb sunlight.
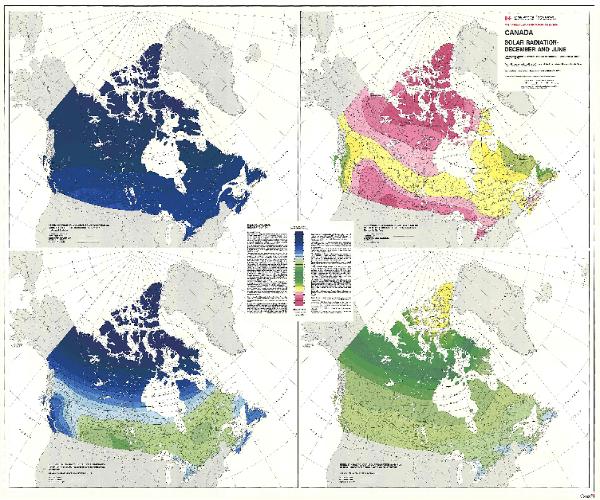
The Canadian solar radiation map below can be enlarged by clicking on it. It is quite large (2M). The values are in MJ/m2/day for the months of June and December. That is Mega Joules (energy) per square meter, per day. If you need kWh per square meter per day for use in the sizing calulcators on other web sites, divide the MJ figure by 3.6 .
The USA solar inslation maps below give values in kWh/m2/day for the month of December. This is killowatt hours (energy) per square meter per day. If you are sizing a system large enough to heat water or the house in the winter, you would need to consider these values.
Here is the USA solar insolation for June. You will see that the values are considerably hight than December. These values will help you calculate the maximum output of your collectors.
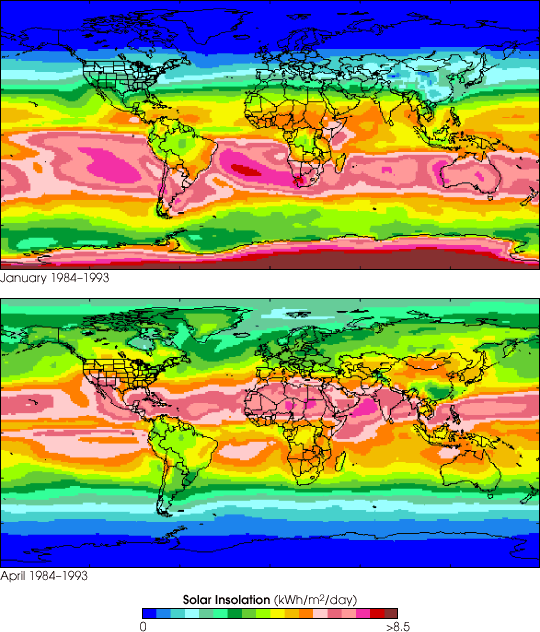
This is a look at the Earth's solar insolation from NASA
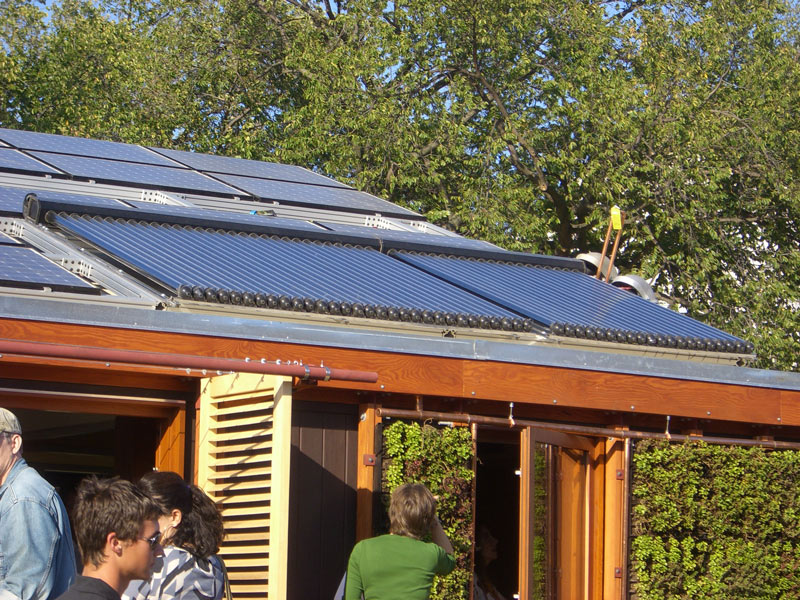
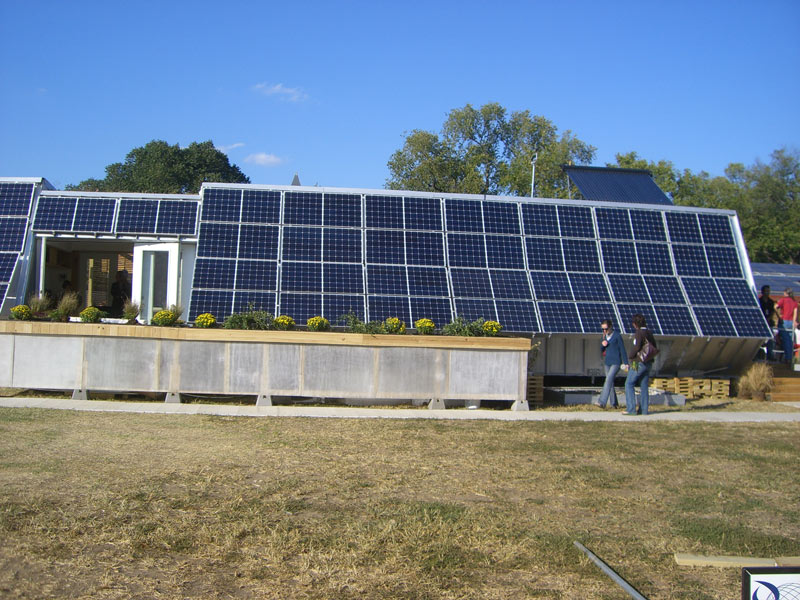
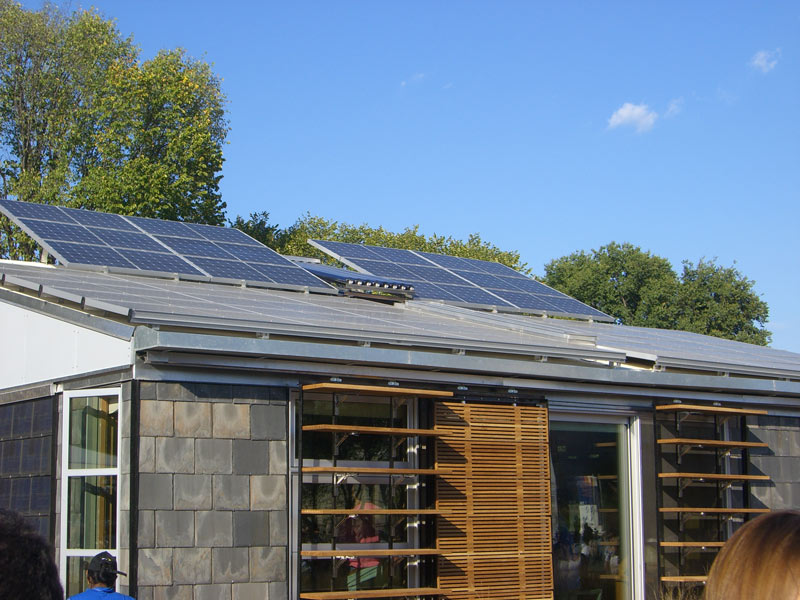
Here are some pictures from the Solar Decathlon held in Washington DC. Notice how the model homes in the competiton are completely covered with solar collectors. The flat ones are for generating electricity. The ones with the tubes are for generating hot water. These are very small, energy efficient micro homes -- so there is no way a typical home is going to go all solar with just a few pannels on the roof.
The next Solar Decathlon is October 9-18, 2009 at the National Mall in Washington DC.
